Python – Pandas and Numpy
#from numpy import *

import numpy as np

import time

def trad_version():

    t1 = time.time()

    X = range (10000000)

    Y = range (10000000)

    Z = []

    for i in range(len(X)):

        Z.append(X[i] + Y[i])

        return time.time() - t1

trad_version()


 ###################

def numpy_version():

    t1 = time.time()

    X = np.arange (10000000)

    Y = np.arange (10000000)

    Z=X+Y

    return time.time() - t1

numpy_version()

##################


from numpy import *

# the argument to the array function is a Python list

v = np.array ([1 ,2 ,3 ,4])

# the argument to the array function is a nested Python list

M = np.array([[1, 2], [3, 4]])

type(v), type(M)

##(numpy.ndarray , numpy.ndarray)

##################


v.shape , M.shape

#((4,), (2, 2))

M.size

#4

M.dtype

#dtype(’int64’)

# Explicitly define the type of the array

M = np.array([[1, 2], [3, 4]], dtype= complex)

##################


 Arrays - Using array-generating functions

x = np.arange(0, 10, 1) # arguments: start , stop , step

#array([0, 1, 2, 3, 4, 5, 6, 7, 8, 9])

np.linspace(0,10,11) # arguments: start, end and number of points ( start and end points are included )

#array([ 0., 1., 2., 3., 4., 5., 6., 7., 8., 9., 10.])

##################


 Diagonal and Zero matrix

np.diag ([1 ,2 ,3]) array([[1, 0, 0], [0, 2, 0],

#[0, 0, 3]])

np.zeros((3,3))

#array([[ 0., 0., 0.], [ 0., 0., 0.], [ 0., 0., 0.]])

##################


 Array Access


M = np.random.rand(3,3)

M

>>> M[1,1]

##################


 Array Access

# Access the first row

M[1]

#array( [ 0.01444674 , 0.13963834 , 0.36263224]) # The first row can be also be accessed using this notation

M[1,:] #array( [ 0.01444674 , 0.13963834 , # Access the first column

M[:,1] array( [ 0.64335721 , 0.13963834 , 0.36263224]) 0.14865659])

##################


 Array Access

# You can also assign values to an entire row or column

M[1,:] = 0

M

#array ([ [ 0.37389376 , 0.64335721 , 0.12435669] , [ 0. , 0. , 0. ], [ 0.00661902 , 0.14865659 , 0.75066302]]) 44/115


 Array Slicing

# Extract slices of an array

M[1:3]

#array ([ [ 0. , 0. , 0. ], [ 0.00661902 ,

>>> M[1:3,1:2]

#array ([ [ 0. ], [ 0.14865659]]) 0.14865659 , 0.75066302]])

##################


 Array Slicing - Negative Indexing

# Negative indices start counting from the end of the array

M[-2]

#array( [ 0., 0., 0.])

M[-1]

#array( [ 0.00661902 , 0.14865659 , 0.75066302])

##################


 Array Operations - Scalar

 These operation are applied to all the elements in the array

M*2

#array ([ [ 0.74778752 , [ 0. , [ 0.01323804 ,

M + 2

#array ([ [ 2.37389376 , [ 2. , [ 2.00661902 , 1.28671443 , 0. , 0.29731317 , 2.64335721 , 2. , 2.14865659 , 0.24871338] , 0. ], 1.50132603]]) 2.12435669] , 2. ], 2.75066302]])

##################


 Matrix multiplication

M * M # Element-wise multiplication

#array ([ [1.397965e-01,4.139085e-01,1.546458e-02], [0.000000e+00,0.000000e+00,0.00000e+00], [4.381141e-05,2.209878e-02,5.634949e-01]])

np.dot(M,M) # Matrix multiplication

#array ([ [ 0.14061966 , 0.25903369 , 0.13984616] , [ 0. , 0. , 0. ], [ 0.00744346 , 0.1158494 , 0.56431808]])

##################


 Iterating over Array Elements

 • In general, avoid iteration over elements

• Iterating is slow compared to a vector operation

• If you must, use the for loop

• In order to enable vectorization, ensure that user-written functions can work with vector inputs.

• Use the vectorize function

• Use the any or all function with arrays

##################


    Vectorize

def Theta(x):

    ifx>=0:

         return 1

    else:

         return 0

Theta (1.0)

Theta ( -1.0)

##################

 Vectorize

 Without vectorize we would not be able to pass v to the function

>>> v

array([1, 2, 3, 4])

>>> Tvec = np.vectorize(Theta)

>>> Tvec(v)

array([1, 1, 1, 1])

>>> Tvec (1.0)

array (1)

##################

 Arrays in conditions

>>> v

array([1, 2, 3, 4])

>>> (v > 3).any() True

>>> (v > 3).all() False
Product Title,Price,Rootstock,Height,Description
Apple Tree,39 ,M12,36,Good tasting fruit.
Apple Tree,39 ,M40,36, ABC
Apple Tree,39 ,M12,50, XYZ
Apple Tree,39 ,M40,50, DEF
Orange Tree,53 ,A67,48,Bad tasting fruit.
Orange Tree,53 ,B78,48, GHK
Orange Tree,70 ,A67,70, LMN
Orange Tree,70 ,B78,70, OPQ

d=pd.read_csv("/Users/amars/temp.csv")
d=pd.read_csv("/Users/amars/temp.csv", header=None)
d=pd.read_csv("/Users/amars/temp.csv", names=["a","b","c","d","e"])

import pandas as pd
hello=pd.read_html("http://www.vce.ac.in/Placements_Summary.aspx?acadYear=2017-2018")
>>> import pandas as pd
>>> import sys
>>> import numpy as np
>>> pd.Series([1,2,3,4,5] ,index=[100,101,102,103,104])
100 1
101 2
102 3
103 4
104 5
dtype: int64
>>> pd.Series([1,2,3,4,5] ,index=["first", "second", "third", "fourth", "fifth"])
first 1
second 2
third 3
fourth 4
fifth 5
dtype: int64
>>> pd.Series(range(5) ,index=["first", "second", "third", "fourth", "fifth"])
first 0
second 1
third 2
fourth 3
fifth 4
dtype: int64
>>> pd.Series(np.array([1,2,3,4,5]) ,index=[100,101,102,103,104])
100 1
101 2
102 3
103 4
104 5
dtype: int64
>>> pd.Series({'Zalary' : 0., 'Yalary' : 1., 'Xalary' : 2.})
df.Xalary 2.0
Yalary 1.0
Zalary 0.0
dtype: float64
>>> pd.Series({'Zalary' : 0., 'Yalary' : 1., 'Xalary' : 2.}, index=['Yalary','Zalary','Xalary'])
Yalary 1.0
Zalary 0.0
Xalary 2.0
dtype: float64
>>> pd.Series("hello", index=[0, 1, 2, 3])
0 hello
1 hello
2 hello
3 hello
dtype: object
>>>
>>>
>>> s=pd.Series({'Zalary' : 0., 'Yalary' : 1., 'Xalary' : 2.}, index=['Yalary','Zalary','Xalary'])
>>> s[0] # slice operations work as usual
1.0
>>>
>>> s[:1]
Yalary 1.0
dtype: float64
>>>
>>> s['Yalary']
1.0
>>>
>>> #s['Kalary']
…
>>> s[['Yalary','Zalary']]
Yalary 1.0
Zalary 0.0
dtype: float64
>>>
>>> print (s.axes)
[Index([u’Yalary’, u’Zalary’, u’Xalary’], dtype=’object’)]
>>> print (s.empty)
False
>>>
>>> print (s.ndim)
1
>>> print (s.size)
3
>>> print (s.values)
[ 1. 0. 2.]
>>> print (s.head(2))
Yalary 1.0
Zalary 0.0
dtype: float64
>>> print (s.tail(2))
Zalary 0.0
Xalary 2.0
dtype: float64
>>>
>>>
>>>
>>> pd.DataFrame()
Empty DataFrame
Columns: []
Index: []
>>>
>>> pd.DataFrame([55,56,57,58,59,60])
0
0 55
1 56
2 57
3 58
4 59
5 60
>>>
>>> pd.DataFrame([55,56,57,58,59,60], [45,46,47,48,49,40])
0
45 55
46 56
47 57
48 58
49 59
40 60
>>> #pd.DataFrame([55,56,57,58,59,60], [45,46,47,48,49,40],[35,36,37,38,39,30])
… #pd.DataFrame([55,56,57,58,59,60], [45,46,47,48,49,40],columns=[35,36,37,38,39,30])
…
>>> pd.DataFrame([55,56,57,58,59,60], columns=['Age'])
Age
0 55
1 56
2 57
3 58
4 59
5 60
>>> pd.DataFrame([55,56,57,58,59,60], columns=['Age'], index=range(100,106))
Age
100 55
101 56
102 57
103 58
104 59
105 60
>>> pd.DataFrame([55,56,57,58,59,60], index=range(100,106))
0
100 55
101 56
102 57
103 58
104 59
105 60
>>> #pd.DataFrame([55,56,57,58,59,60], columns=['Age','Name'], index=range(100,106))
…
>>> data=[('Krishna',2012),('Srikanth',2013),('Mohan',2014),('Akbar',2015)]
>>> pd.DataFrame(data)
0 1
0 Krishna 2012
1 Srikanth 2013
2 Mohan 2014
3 Akbar 2015
>>> pd.DataFrame(data,index=range(1,5), columns=['Name','Roll No.'])
Name Roll No.
1 Krishna 2012
2 Srikanth 2013
3 Mohan 2014
4 Akbar 2015
>>> pd.DataFrame(data, columns=['Name','Roll No.'])
Name Roll No.
0 Krishna 2012
1 Srikanth 2013
2 Mohan 2014
3 Akbar 2015
>>> pd.DataFrame(data,index=range(1,5))
0 1
1 Krishna 2012
2 Srikanth 2013
3 Mohan 2014
4 Akbar 2015
>>> #pd.DataFrame(data,index=range(1,6))
…
>>> #pd.DataFrame(data,index=range(100,106), columns=['Name','Roll No.'], dtype=int)
…
>>> pd.DataFrame(data,index=range(100,104), columns=['Name','Roll No.'], dtype=float)
Name Roll No.
100 Krishna 2012.0
101 Srikanth 2013.0
102 Mohan 2014.0
103 Akbar 2015.0
>>>
>>> pd.DataFrame(data,index=range(100,104), columns=['Name','Roll No.'], dtype=str)
Name Roll No.
100 Krishna 2012
101 Srikanth 2013
102 Mohan 2014
103 Akbar 2015
>>>
>>>
>>>
>>> data = {'Name':['Krishna', 'Srikanth', 'Mohan', 'Akbar'],'Roll No.':[2012,2013,2014,2015]}
>>>
>>> pd.DataFrame(data)
Name Roll No.
0 Krishna 2012
1 Srikanth 2013
2 Mohan 2014
3 Akbar 2015
>>> pd.DataFrame(data, columns=['Roll No.','Name'])
Roll No. Name
0 2012 Krishna
1 2013 Srikanth
2 2014 Mohan
3 2015 Akbar
>>> pd.DataFrame(data, columns=['Roll No.','Age'])
Roll No. Age
0 2012 NaN
1 2013 NaN
2 2014 NaN
3 2015 NaN
>>> pd.DataFrame(data, columns=['SirName','Age'])
Empty DataFrame
Columns: [SirName, Age]
Index: []
>>> pd.DataFrame(data, columns=['Roll No.','Name'], index=['Fist','Second','Third','Fourth'])
Roll No. Name
Fist 2012 Krishna
Second 2013 Srikanth
Third 2014 Mohan
Fourth 2015 Akbar
>>>
>>> data = [{'Age': 1, 'Name': 2},{'Age': 5, 'Name': 10, 'RollNo': 20}]
>>> pd.DataFrame(data)
Age Name RollNo
0 1 2 NaN
1 5 10 20.0
>>>
>>>
34
>>> data={'Age': 1, 'RollNo': 2}
>>> #pd.DataFrame(data)
…
>>> pd.DataFrame(data, index=range(5))
tarun’, ‘ niharia saitan Age RollNo
0 1 2
1 1 2
2 1 2
3 1 2
4 1 2
>>>
>>> data = [{'a': 1, 'b': 2},{'a': 5, 'b': 10, 'c': 20}]
>>> data = [{'Age': 1, 'Name': 2},{'Age': 5, 'Name': 10, 'RollNo': 20}]
>>> pd.DataFrame(data, index=['first', 'second'])
Age Name RollNo
first 1 2 NaN
second 5 10 20.0
>>> pd.DataFrame(data, index=['first', 'second'], columns=['Name','RollNo','Salary'])
Name RollNo Salary
first 2 NaN NaN
second 10 20.0 NaN
>>>
>>>
>>> data = {'B.Tech' : pd.Series([1, 2, 3], index=['First', 'Second', 'Third']), 'M.Tech' : pd.Series([1, 2, 3, 4], index=['First', 'Second', 'Third','Others'])}
>>>
>>> pd.DataFrame(data)
B.Tech M.Tech
First 1.0 1
Others NaN 4
Second 2.0 2
Third 3.0 3
>>>
>>>
>>> pd.DataFrame(data)['B.Tech']
First 1.0
Others NaN
Second 2.0
Third 3.0
Name: B.Tech, dtype: float64
>>>
>>> df=pd.DataFrame(data)
>>>
>>> df['MCA']=pd.Series([10,20,30],index=['First','Second','Third'])
>>>
>>> df['MBA']=df['MCA']+df['M.Tech']
>>>
>>>
>>>
>>> del df['MBA']
>>>
>>> df.pop('B.Tech')
First 1.0
Others NaN
Second 2.0
Third 3.0
Name: B.Tech, dtype: float64
>>>
>>> df.loc['Third']
M.Tech 3.0
MCA 30.0
Name: Third, dtype: float64
>>> df.loc[['Third']]
M.Tech MCA
Third 3 30.0
>>> print (df.loc[['Second','Third']])
M.Tech MCA
Second 2 20.0
Third 3 30.0
>>>
>>> df.iloc[2]
M.Tech 2.0
MCA 20.0
Name: Second, dtype: float64
>>>
>>> print (df[1:3])
M.Tech MCA
Others 4 NaN
Second 2 20.0
>>>
>>> df = df.append(df)
>>>
>>> df = df.drop('First')
>>>
>>> #----------- Panel ---------
… np.random.rand(2,4,5)
array([[[ 0.44023296, 0.94780197, 0.34127866, 0.80214433, 0.89869687],
[ 0.45540358, 0.28254223, 0.8242587 , 0.93645243, 0.73314586],
[ 0.61816259, 0.14943283, 0.53558631, 0.13632281, 0.57688247],
[ 0.33861119, 0.93842306, 0.61473785, 0.70063857, 0.76176029]],
[[ 0.96112907, 0.7994162 , 0.07787286, 0.60664962, 0.28293822],
[ 0.65587606, 0.39380819, 0.1602769 , 0.11515688, 0.25920132],
[ 0.20795465, 0.81207782, 0.68106295, 0.50521484, 0.45884116],
[ 0.73427749, 0.77144052, 0.7062344 , 0.86032186, 0.08794581]]])
>>>
>>> pd.Panel(np.random.rand(2,4,5))
<class ‘pandas.core.panel.Panel’>
Dimensions: 2 (items) x 4 (major_axis) x 5 (minor_axis)
Items axis: 0 to 1
Major_axis axis: 0 to 3
Minor_axis axis: 0 to 4
>>>
>>>
>>> data = {'B.Tech' : pd.Series([1, 2, 3], index=['First', 'Second', 'Third']), 'M.Tech' : pd.Series([1, 2, 3, 4], index=['First', 'Second', 'Third','Others'])}
>>>
>>> df1= pd.DataFrame(data)
>>>
>>> data = {'B.A' : pd.Series([1, 2, 3], index=['First', 'Second', 'Third']), 'B.Sc' : pd.Series([1, 2, 3, 4], index=['First', 'Second', 'Third','Others'])}
>>>
>>> df2= pd.DataFrame(data)
>>>
>>> global_data={'Non engineerng':df2 , 'Engineering':df1 }
>>> p=pd.Panel(global_data)
>>>
>>>
>>>
>>> data = {'B.Tech' : pd.Series([1, 2, 3]), 'M.Tech' : pd.Series([1, 2, 3, 4])}
>>>
>>> df1= pd.DataFrame(data)
>>>
>>> data = {'B.A' : pd.Series([1, 2, 3]), 'B.Sc' : pd.Series([1, 2, 3, 4])}
>>>
>>> df2= pd.DataFrame(data)
>>>
>>> global_data={'Non engineerng':df2 , 'Engineering':df1 }
>>> p=pd.Panel(global_data)
>>>
>>>
>>> print (p.major_xs(1))
Engineering Non engineerng
B.A NaN 2.0
B.Sc NaN 2.0
B.Tech 2.0 NaN
M.Tech 2.0 NaN
>>>
>>>
 >>> #Create a Dictionary of series
>>>d ={'Name':pd.Series(['Mohan','Aditya','Niharika','Srivastava','Vamsi','Akhil','Sunaina']),'Age':pd.Series([25,26,20,23,20,29,24]), 'Salary':pd.Series([2144.23,3453.24,4563.98,1232.56,2343.20,9874.6,3433.8])}
>>>
 >>> #Create a DataFrame
>>>df = pd.DataFrame(d)
.
>>> print (("Our data series is:"))
Our data series is:
>>> print (df)
Age Name Salary
0 25 Mohan 2144.23
1 26 Aditya 3453.24
2 20 Niharika 4563.98
3 23 Srivastava 1232.56
4 20 Vamsi 2343.20
5 29 Akhil 9874.60
6 24 Sunaina 3433.80
>>>
>>> df.T
0 1 2 3 4 5 6
Age 25 26 20 23 20 29 24
Name Mohan Aditya Niharika Srivastava Vamsi Akhil Sunaina
Salary 2144.23 3453.24 4563.98 1232.56 2343.2 9874.6 3433.8
>>> print (df.axes)
[RangeIndex(start=0, stop=7, step=1), Index([u’Age’, u’Name’, u’Salary’], dtype=’object’)]
>>>
>>> print (df.dtypes)
Age int64
Name object
Salary float64
dtype: object
>>> print (df.empty)
False
>>>
>>> print (df.ndim)
2
>>> print (df.shape)
(7, 3)
>>>
>>> print (df.size)
21
>>>
>>> print (df.values)
[[25 ‘Mohan’ 2144.23]
[26 ‘Aditya’ 3453.24]
[20 ‘Niharika’ 4563.98]
[23 ‘Srivastava’ 1232.56]
[20 ‘Vamsi’ 2343.2]
[29 ‘Akhil’ 9874.6]
[24 ‘Sunaina’ 3433.8]]
>>> print (df.head(2))
Age Name Salary
0 25 Mohan 2144.23
1 26 Aditya 3453.24
>>> print (df.tail(2))
get_group(2014))
pr Age Name Salary
5 29 Akhil 9874.6
6 24 Sunaina 3433.8
>>> print (df.sum())
Age 167
Name MohanAdityaNiharikaSrivastavaVamsiAkhilSunaina
Salary 27045.6
dtype: object
>>>
>>> print (df.sum(1))
0 2169.23
1 3479.24
2 4583.98
3 1255.56
4 2363.20
5 9903.60
6 3457.80
dtype: float64
>>>
>>> #print (df.sum(2))
…
>>> print (df.mean())
Age 23.857143
Salary 3863.658571
dtype: float64
>>> print (df.mean(0))
Age 23.857143
Salary 3863.658571
dtype: float64
>>> print (df.mean(1))
0 1084.615
1 1739.620
2 2291.990
3 627.780
4 1181.600
5 4951.800
6 1728.900
dtype: float64
>>>
>>> print (df.std())
Age 3.236694
Salary 2862.574521
dtype: float64
>>>
>>> print (df.median())
Age 24.0
Salary 3433.8
dtype: float64
>>>
>>> print (df.describe())
Age Salary
count 7.000000 7.000000
mean 23.857143 3863.658571
std 3.236694 2862.574521
min 20.000000 1232.560000
25% 21.500000 2243.715000
50% 24.000000 3433.800000
75% 25.500000 4008.610000
max 29.000000 9874.600000
>>>
>>> print (df.describe(include=['object']))
Name
count 7
unique 7
top Akhil
freq 1
>>>
)
>>> df. describe(include='all')
Age Name Salary
count 7.000000 7 7.000000
unique NaN 7 NaN
top NaN Akhil NaN
freq NaN 1 NaN
mean 23.857143 NaN 3863.658571
std 3.236694 NaN 2862.574521
min 20.000000 NaN 1232.560000
25% 21.500000 NaN 2243.715000
50% 24.000000 NaN 3433.800000
75% 25.500000 NaN 4008.610000
max 29.000000 NaN 9874.600000
>>>
a
 >>> def adder(ele1,ele2):
         return ele1+ele2
>>> df = pd.DataFrame(np.random.randn(5,3),columns=['col1','col2','col3'])
>>>
>>> df
col1 col2 col3
0 1.400437 0.182416 -1.194210
1 -1.874784 0.922849 -0.713478
2 -0.371939 0.609757 -0.030975
3 -0.567182 1.453366 0.355019
4 -1.787287 0.798718 0.956687
>>>
>>> df.pipe(adder,2)
col1 col2 col3
0 3.400437 2.182416 0.805790
1 0.125216 2.922849 1.286522
2 1.628061 2.609757 1.969025
3 1.432818 3.453366 2.355019
4 0.212713 2.798718 2.956687
>>>
>>> print (df.apply(np.mean))
col1 -0.640151
col2 0.793421
col3 -0.125391
dtype: float64
>>>
>>> df.apply(np.mean,axis=1)
0 0.129548
1 -0.555137
2 0.068948
3 0.413734
4 -0.010627
dtype: float64
>>>
>>> df.apply(lambda x: x.max() - x.min())
col1 3.275221
col2 1.270949
col3 2.150897
dtype: float64
>>> df.apply(lambda x: x.sum(), axis=1)
0 0.388644
1 -1.665412
2 0.206843
3 1.241203
4 -0.031882
dtype: float64
>>>
>>> df['col1'].map(lambda x:x*100)
0 140.043741
1 -187.478363
2 -37.193887
3 -56.718190
4 -178.728746
Name: col1, dtype: float64
>>>
>>> data = {'B.Tech' : pd.Series([1, 2, 3], index=['First', 'Second', 'Third']), 'M.Tech' : pd.Series([1, 2, 3, 4], index=['First', 'Second', 'Third','Others'])}
>>>
>>> df=pd.DataFrame(data)
>>>
 >>> for key,value in df.iteritems():
         print (key,value)
… …
(‘B.Tech’, First 1.0
Others NaN
Second 2.0
Third 3.0
Name: B.Tech, dtype: float64)
(‘M.Tech’, First 1
Others 4
Second 2
Third 3
Name: M.Tech, dtype: int64)
 >>> for row_index,row in df.iterrows():
         print (row_index,row)
…
(‘First’, B.Tech 1.0
M.Tech 1.0
Name: First, dtype: float64)
(‘Others’, B.Tech NaN
M.Tech 4.0
Name: Others, dtype: float64)
(‘Second’, B.Tech 2.0
M.Tech 2.0
Name: Second, dtype: float64)
(‘Third’, B.Tech 3.0
M.Tech 3.0
Name: Third, dtype: float64)
>>>
>>>
b
>>>
>>> data = {'B.Tech' : pd.Series([1, 2, 3], index=['Yirst', 'Zecond', 'Ahird']), 'M.Tech' : pd.Series([4, 33, 17, 101], index=['Yirst', 'Zecond', 'Ahird','Others'])}
>>>
>>> df=pd.DataFrame(data)
>>>
>>> df.sort_index()
B.Tech M.Tech
Ahird 3.0 17
Others NaN 101
Yirst 1.0 4
Zecond 2.0 33
>>>
>>> df.sort_index(ascending=False)
B.Tech M.Tech
Zecond 2.0 33
Yirst 1.0 4
Others NaN 101
Ahird 3.0 17
>>>
>>> df.sort_index(axis=1)
B.Tech M.Tech
Ahird 3.0 17
Others NaN 101
Yirst 1.0 4
Zecond 2.0 33
>>> df.sort_index(axis=0) # default
B.Tech M.Tech
Ahird 3.0 17
Others NaN 101
Yirst 1.0 4
Zecond 2.0 33
>>>
>>> df.sort_values(by='M.Tech')
B.Tech M.Tech
Yirst 1.0 4
Ahird 3.0 17
Zecond 2.0 33
Others NaN 101
>>>
>>> df.sort_values(by='B.Tech', ascending=False)
B.Tech M.Tech
Ahird 3.0 17
Zecond 2.0 33
Yirst 1.0 4
Others NaN 101
>>>
 >>> for row_index,row in df.iterrows():
        print (row_index,row)
…
(‘Ahird’, B.Tech 3.0
M.Tech 17.0
Name: Ahird, dtype: float64)
(‘Others’, B.Tech NaN
M.Tech 101.0
Name: Others, dtype: float64)
(‘Yirst’, B.Tech 1.0
M.Tech 4.0
Name: Yirst, dtype: float64)
(‘Zecond’, B.Tech 2.0
M.Tech 33.0
Name: Zecond, dtype: float64)
>>> s = pd.Series(['12345','Mohan 123 ', 'Sunaina Singh', 'Ashish', 'Akhil Dhaval', 'tarun', ' niharia saitana ','PRUDHVI SINGH'])
>>>
>>> print (s.str.lower())
0 12345
1 mohan 123
2 sunaina singh
3 ashish
4 akhil dhaval
5 tarun
6 niharia saitana
7 prudhvi singh
dtype: object
>>>
>>> print (s.str.upper())
0 12345
1 MOHAN 123
2 SUNAINA SINGH
3 ASHISH
4 AKHIL DHAVAL
5 TARUN
6 NIHARIA SAITANA
7 PRUDHVI SINGH
dtype: object
>>>
>>> print (s.str.len())
0 5
1 10
2 13
3 6
4 12
5 5
6 17
7 13
dtype: int64
>>>
>>> print (s.str.strip())
0 12345
1 Mohan 123
2 Sunaina Singh
3 Ashish
4 Akhil Dhaval
5 tarun
6 niharia saitana
7 PRUDHVI SINGH
dtype: object
>>>
>>> print (s.str.split(' '))
0 [12345]
1 [Mohan, 123, ]
2 [Sunaina, Singh]
3 [Ashish]
4 [Akhil, Dhaval]
5 [tarun]
6 [, niharia, saitana, ]
7 [PRUDHVI, SINGH]
dtype: object
>>>
>>> print (s.str.cat(sep='_'))
12345_Mohan 123 _Sunaina Singh_Ashish_Akhil Dhaval_tarun_ niharia saitana _PRUDHVI SINGH
>>>
>>>
>>> print (s.str.contains(' '))
0 False
1 True
2 True
3 False
4 True
5 False
6 True
7 True
dtype: bool
>>>
>>>
>>> print (s.str.replace('n','P'))
0 12345
1 MohaP 123
2 SuPaiPa SiPgh
3 Ashish
4 Akhil Dhaval
5 taruP
6 Piharia saitaPa
7 PRUDHVI SINGH
dtype: object
>>>
>>> print (s.str.repeat(2))
0 1234512345
1 Mohan 123 Mohan 123
2 Sunaina SinghSunaina Singh
3 AshishAshish
4 Akhil DhavalAkhil Dhaval
5 taruntarun
6 niharia saitana niharia saitana
7 PRUDHVI SINGHPRUDHVI SINGH
dtype: object
>>>
>>> print (s.str.count('m'))
0 0
1 0
2 0
3 0
4 0
5 0
6 0
7 0
dtype: int64
>>> print (s.str. startswith ('T'))
0 False
1 False
2 False
3 False
4 False
5 False
6 False
7 False
dtype: bool
>>>
>>> print (s.str.endswith('a'))
0 False
1 False
2 False
3 False
4 False
5 False
6 False
7 False
dtype: bool
>>>
>>> print (s.str.find('a'))
0 -1
1 3
2 3
3 -1
4 8
5 1
6 4
7 -1
dtype: int64
>>>
>>> print (s.str.findall('e'))
0 []
1 []
2 []
3 []
4 []
5 []
6 []
7 []
dtype: object
>>>
>>> print (s.str.swapcase())
0 12345
1 mOHAN 123
2 sUNAINA sINGH
3 aSHISH
4 aKHIL dHAVAL
5 TARUN
6 NIHARIA SAITANA
7 prudhvi singh
dtype: object
>>>
>>> print (s.str.islower())
0 False
1 False
2 False
3 False
4 False
5 True
6 True
7 False
dtype: bool
>>>
>>> print (s.str.isupper())
0 False
1 False
2 False
3 False
4 False
5 False
6 False
7 True
dtype: bool
>>>
>>> print (s.str.isnumeric())
0 True
1 False
2 False
3 False
4 False
5 False
6 False
7 False
dtype: bool
>>>
>>> s = pd.Series(['12345','Mohan 123 ', 'Sunaina Singh', 'Ashish', 'Akhil Dhaval', 'tarun', ' niharia saitana ','PRUDHVI SINGH'])
>>>
>>> data = {'B.Tech' : pd.Series([1, 2, 3], index=['Yirst', 'Zecond', 'Ahird']), 'M.Tech' : pd.Series([4, 33, 17, 101], index=['Yirst', 'Zecond', 'Ahird','Others'])}
>>>
>>> df=pd.DataFrame(data)
>>> print (df.loc[:,['B.Tech','M.Tech']])
B.Tech M.Tech
Ahird 3.0 17
Others NaN 101
Yirst 1.0 4
Zecond 2.0 33
>>>
>>> print (df.loc[:,['B.Tech']])
B.Tech
Ahird 3.0
Others NaN
Yirst 1.0
Zecond 2.0
>>>
>>> print (df.loc[:,['B.Tech']])
B.Tech
Ahird 3.0
Others NaN
Yirst 1.0
Zecond 2.0
>>>
>>> print (df.loc[['Yirst', 'Zecond'],['B.Tech']])
B.Tech
Yirst 1.0
Zecond 2.0
>>> print (df.loc['Ahird':'Yirst'])
B.Tech M.Tech
Ahird 3.0 17
Others NaN 101
Yirst 1.0 4
>>> print (df.iloc[:2])
B.Tech M.Tech
Ahird 3.0 17
Others NaN 101
>>>
>>> print (df.pct_change())
B.Tech M.Tech
Ahird NaN NaN
Others NaN 4.941176
Yirst -0.666667 -0.960396
Zecond 1.000000 7.250000
>>>
>>> s1 = pd.Series(np.random.randn(10))
>>> s2 = pd.Series(np.random.randn(10))
>>> print (s1.cov(s2))
0.136523457171
>>>
>>>
>>> frame = pd.DataFrame(np.random.randn(10, 5), columns=['a', 'b', 'c', 'd', 'e'])
>>> print (frame['a'].cov(frame['b']))
0.438596171068
>>> print (frame.cov())
a b c d e
a 0.921496 0.438596 0.373506 -0.157574 -0.752472
b 0.438596 0.989065 -0.055826 0.163365 -0.044081
c 0.373506 -0.055826 1.137479 0.258166 -0.162655
d -0.157574 0.163365 0.258166 0.442239 0.269647
e -0.752472 -0.044081 -0.162655 0.269647 1.142841
>>>
>>>
>>> frame = pd.DataFrame(np.random.randn(10, 5), columns=['a', 'b', 'c', 'd', 'e'])
>>>
>>> print (frame['a'].corr(frame['b']))
-0.596900636566
>>>
>>> print (frame.corr())
a b c d e
a 1.000000 -0.596901 -0.080054 -0.102387 -0.428141
b -0.596901 1.000000 0.254387 0.034177 0.494483
c -0.080054 0.254387 1.000000 0.358375 0.017059
d -0.102387 0.034177 0.358375 1.000000 -0.112376
e -0.428141 0.494483 0.017059 -0.112376 1.000000
>>>
>>> s = pd.Series(np.random.np.random.randn(5), index=list('abcde'))
>>>
>>> s['d'] = s['b'] # so there's a tie
>>>
>>> print (s.rank())
a 2.0
b 3.5
c 1.0
d 3.5
e 5.0
dtype: float64
>>>
>>> df = pd.DataFrame([(2,3,4,5), (20,30,40,50),(200,300,400,500), (2000,3000,4000,5000), (6,7,8,9),(60,70,80,90),(600,700,800,900), (6000,7000,8000,9000), (10,11,12,13) (14,15,16,17)] ,index = pd.date_range('1/1/2000', periods=10), columns = ['A', 'B', 'C', 'D'])
>>>
>>> r = df.rolling(window=3,min_periods=1)
>>>
>>> print (r)
Rolling [window=3,min_periods=1,center=False,axis=0]
>>>
>>> print (r.aggregate(np.sum))
A B C D
2000-01-01 2.0 3.0 4.0 5.0
2000-01-02 22.0 33.0 44.0 55.0
2000-01-03 222.0 333.0 444.0 555.0
2000-01-04 2220.0 3330.0 4440.0 5550.0
2000-01-05 2206.0 3307.0 4408.0 5509.0
2000-01-06 2066.0 3077.0 4088.0 5099.0
2000-01-07 666.0 777.0 888.0 999.0
2000-01-08 6660.0 7770.0 8880.0 9990.0
2000-01-09 6610.0 7711.0 8812.0 9913.0
2000-01-10 6024.0 7026.0 8028.0 9030.0
>>>
>>>
>>> print (r['A'].aggregate(np.sum))
2000-01-01 2.0
2000-01-02 22.0
2000-01-03 222.0
2000-01-04 2220.0
2000-01-05 2206.0
2000-01-06 2066.0
2000-01-07 666.0
2000-01-08 6660.0
2000-01-09 6610.0
2000-01-10 6024.0
Freq: D, Name: A, dtype: float64
>>>
>>> print (r[['A','B']].aggregate(np.sum))
A B
2000-01-01 2.0 3.0
2000-01-02 22.0 33.0
2000-01-03 222.0 333.0
2000-01-04 2220.0 3330.0
2000-01-05 2206.0 3307.0
2000-01-06 2066.0 3077.0
2000-01-07 666.0 777.0
2000-01-08 6660.0 7770.0
2000-01-09 6610.0 7711.0
2000-01-10 6024.0 7026.0
>>>
>>> print (r['A'].aggregate([np.sum,np.mean]))
sum mean
2000-01-01 2.0 2.000000
2000-01-02 22.0 11.000000
2000-01-03 222.0 74.000000
2000-01-04 2220.0 740.000000
2000-01-05 2206.0 735.333333
2000-01-06 2066.0 688.666667
2000-01-07 666.0 222.000000
2000-01-08 6660.0 2220.000000
2000-01-09 6610.0 2203.333333
2000-01-10 6024.0 2008.000000
>>> print (r[['A','B']].aggregate([np.sum,np.mean]))
A B
sum mean sum mean
2000-01-01 2.0 2.000000 3.0 3.000000
2000-01-02 22.0 11.000000 33.0 16.500000
2000-01-03 222.0 74.000000 333.0 111.000000
2000-01-04 2220.0 740.000000 3330.0 1110.000000
2000-01-05 2206.0 735.333333 3307.0 1102.333333
2000-01-06 2066.0 688.666667 3077.0 1025.666667
2000-01-07 666.0 222.000000 777.0 259.000000
2000-01-08 6660.0 2220.000000 7770.0 2590.000000
2000-01-09 6610.0 2203.333333 7711.0 2570.333333
2000-01-10 6024.0 2008.000000 7026.0 2342.000000
>>> print (r.aggregate({'A' : np.sum,'B' : np.mean}))
A B
2000-01-01 2.0 3.000000
2000-01-02 22.0 16.500000
2000-01-03 222.0 111.000000
2000-01-04 2220.0 1110.000000
2000-01-05 2206.0 1102.333333
2000-01-06 2066.0 1025.666667
2000-01-07 666.0 259.000000
2000-01-08 6660.0 2590.000000
2000-01-09 6610.0 2570.333333
2000-01-10 6024.0 2342.000000
>>>
>>>
>>>
>>> World_Cup= {'Team': ['India', 'India', 'Pakistan', 'Pakistan', 'Newzealand','Srilanka', 'Newzealand', 'Newzealand', 'India', 'Australia', 'Australia', 'India'], 'Rank': [1, 2, 2, 3, 3,4 ,1 ,1,2 , 4,1,2], 'Year': [2014,2015,2014,2015,2014,2015,2016,2017,2016,2014,2015,2017], 'Points':[876,789,863,673,741,812,756,788,694,701,804,690]}
>>> df = pd.DataFrame(World_Cup)
>>>
>>> print (df)
Points Rank Team Year
0 876 1 India 2014
1 789 2 India 2015
2 863 2 Pakistan 2014
3 673 3 Pakistan 2015
4 741 3 Newzealand 2014
5 812 4 Srilanka 2015
6 756 1 Newzealand 2016
7 788 1 Newzealand 2017
8 694 2 India 2016
9 701 4 Australia 2014
10 804 1 Australia 2015
11 690 2 India 2017
>>>
>>> df.groupby('Team').groups
{‘Srilanka’: Int64Index([5], dtype=’int64′), ‘Australia’: Int64Index([9, 10], dtype=’int64′), ‘India’: Int64Index([0, 1, 8, 11], dtype=’int64′), ‘Newzealand’: Int64Index([4, 6, 7], dtype=’int64′), ‘Pakistan’: Int64Index([2, 3], dtype=’int64′)}
>>>
>>> print (df.groupby(['Team','Year']).groups)
{(‘India’, 2017): Int64Index([11], dtype=’int64′), (‘India’, 2016): Int64Index([8], dtype=’int64′), (‘Newzealand’, 2014): Int64Index([4], dtype=’int64′), (‘Newzealand’, 2016): Int64Index([6], dtype=’int64′), (‘Australia’, 2014): Int64Index([9], dtype=’int64′), (‘Newzealand’, 2017): Int64Index([7], dtype=’int64′), (‘Australia’, 2015): Int64Index([10], dtype=’int64′), (‘India’, 2015): Int64Index([1], dtype=’int64′), (‘India’, 2014): Int64Index([0], dtype=’int64′), (‘Srilanka’, 2015): Int64Index([5], dtype=’int64′), (‘Pakistan’, 2014): Int64Index([2], dtype=’int64′), (‘Pakistan’, 2015): Int64Index([3], dtype=’int64′)}
>>> grouped = df.groupby('Year')
>>>
>>> for name,group in grouped:
… print (name)
… print (group)
…
2014
Points Rank Team Year
0 876 1 India 2014
2 863 2 Pakistan 2014
4 741 3 Newzealand 2014
9 701 4 Australia 2014
2015
Points Rank Team Year
1 789 2 India 2015
3 673 3 Pakistan 2015
5 812 4 Srilanka 2015
10 804 1 Australia 2015
2016
Points Rank Team Year
6 756 1 Newzealand 2016
8 694 2 India 2016
2017
Points Rank Team Year
7 788 1 Newzealand 2017
11 690 2 India 2017
>>> print (grouped.get_group(2014))
Points Rank Team Year
0 876 1 India 2014
2 863 2 Pakistan 2014
4 741 3 Newzealand 2014
9 701 4 Australia 2014
>>> print (grouped['Points'].agg(np.mean))
Year
2014 795.25
2015 769.50
2016 725.00
2017 739.00
Name: Points, dtype: float64
>>> print (grouped['Points'].agg(np.sum))
Year
2014 3181
2015 3078
2016 1450
2017 1478
Name: Points, dtype: int64
>>>
>>> print (grouped.agg(np.size))
Points Rank Team
Year
2014 4 4 4
2015 4 4 4
2016 2 2 2
2017 2 2 2
>>> print (grouped['Points'].agg([np.sum, np.mean, np.std]))
sum mean std
Year
2014 3181 795.25 87.439026
2015 3078 769.50 65.035888
2016 1450 725.00 43.840620
2017 1478 739.00 69.296465
>>> print (df.groupby('Team').filter(lambda x: len(x) >= 3))
Points Rank Team Year
0 876 1 India 2014
1 789 2 India 2015
4 741 3 Newzealand 2014
6 756 1 Newzealand 2016
7 788 1 Newzealand 2017
8 694 2 India 2016
11 690 2 India 2017
>>> print (grouped.transform(lambda x: (x - x.mean()) / x.std()*10))
Points Rank
0 9.235007 -11.618950
1 2.998345 -3.872983
2 7.748256 -3.872983
3 -14.837962 3.872983
4 -6.204323 3.872983
5 6.534854 11.618950
6 7.071068 -7.071068
7 7.071068 -7.071068
8 -7.071068 7.071068
9 -10.778940 11.618950
10 5.304763 -11.618950
11 -7.071068 7.071068
>>>
>>>
>>>
>>> left=pd.DataFrame({ 'id':[1,2,3,4,5], 'Name': ['Mohan', 'Mahesh', 'Niharika', 'Akhil', 'Srivastava'], 'subject_id':['Maths','Chemistry','Geography','Civics','Computes']})
>>>
>>> right = pd.DataFrame(
… {‘id’:[1,2,3,4,5],
… ‘Name’: [‘Sunaina’, ‘Abhimanyu’, ‘Apurav’, ‘Srikanth’, ‘Tarun’],
… ‘subject_id’:[‘Chemistry’,’Geography’,’Telgu’,’Civics’,’Electrical’]})
>>> print (pd.merge(left,right,on='id'))
Name_x id subject_id_x Name_y subject_id_y
0 Mohan 1 Maths Sunaina Chemistry
1 Mahesh 2 Chemistry Abhimanyu Geography
2 Niharika 3 Geography Apurav Telgu
3 Akhil 4 Civics Srikanth Civics
4 Srivastava 5 Computers Tarun Electrical
>>> print (pd.merge(left,right,on=['id','subject_id']))
Name_x id subject_id Name_y
0 Akhil 4 Civics Srikanth
>>> print (pd.merge(left, right, on='subject_id', how='left'))
Name_x id_x subject_id Name_y id_y
0 Mohan 1 Maths NaN NaN
1 Mahesh 2 Chemistry Sunaina 1.0
2 Niharika 3 Geography Abhimanyu 2.0
3 Akhil 4 Civics Srikanth 4.0
4 Srivastava 5 Computers NaN NaN
>>>
>>>
>>> print (pd.merge(left, right, on='subject_id', how='right'))
Name_x id_x subject_id Name_y id_y
0 Mahesh 2.0 Chemistry Sunaina 1
1 Niharika 3.0 Geography Abhimanyu 2
2 Akhil 4.0 Civics Srikanth 4
3 NaN NaN Telgu Apurav 3
4 NaN NaN Electrical Tarun 5
>>>
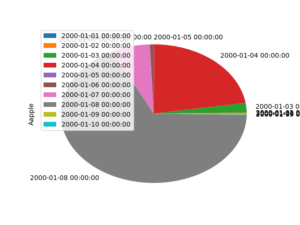
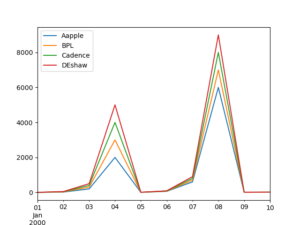
>>>import pandas as pd
>>>import numpy as np
>>>import matplotlib.pyplot as plt
>>>df = pd.DataFrame([(2,3,4,5), (20,30,40,50),(200,300,400,500), (2000,3000,4000,5000), (6,7,8,9),(60,70,80,90),(600,700,800,900), (6000,7000,8000,9000), (10,11,12,13), (14,15,16,17)] ,index = pd.date_range('1/1/2000', periods=10), columns = ['Apple', 'BPL', 'Cadence', 'DEshaw'])
>>>df.plot()
>>>plt.savefig('linechart.png')
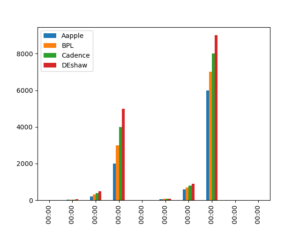
>>>df.plot.bar()
>>>plt.savefig('barchart.png')
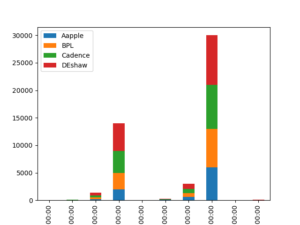
>>>df.plot.bar(stacked=True)
>>>plt.savefig('barchart_stacked.png')
>>>df.plot.barh(stacked=True)
>>>plt.savefig('barchart_horiz.png')

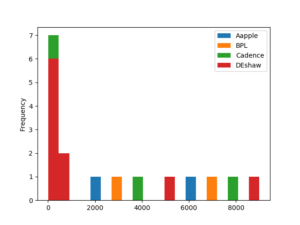
>>>df.plot.hist(bins=20)
>>>plt.savefig('histogram.png')
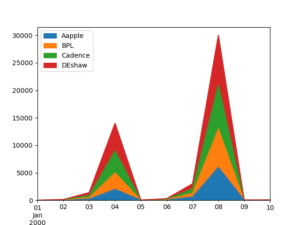
>>>df.plot.area()
>>>plt.savefig('area.png')
>>>df.plot.pie(subplots=True)
>>>plt.savefig('pie.png')