Skip to content
Elasticsearch/Logstash/Kibana in AWS
Creating a Elasticsearch/Logstash/Kibana in AWS
- First login your Account
- Access to AWS services.
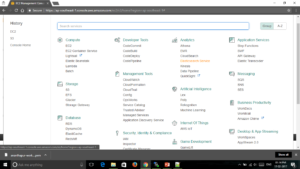
- Select the Elasticsearch under the Analytics as showing in the below.
- After selectting that you will see page as shown in below
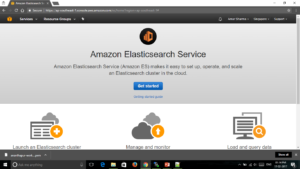
- Click on get started button
- You will see the page as shown n below
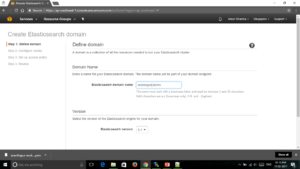
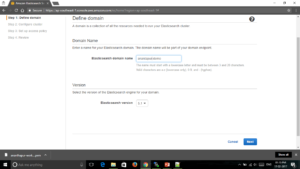
- Follow all four steps
- Filll the details,enter the Elasticsearch domain name as ananthapur-demo
- Elasticseaarch version as 5.1.
- Then click next button as shown in the below image
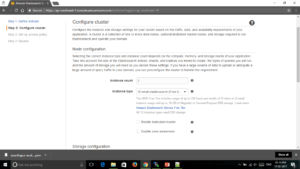
- In the step-2 enter the Instance count as 2.
- Instance type as t2.small elasticsearch as shown in the below image
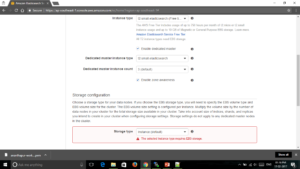
- check the Enable Dedicated Master
- Select the Dedicated Master Instance Type as t2.small elasticsearch
- select Dedicated Master Instance Count as 3(default) and
- Check the Enable zone awareness as shown in the below image..
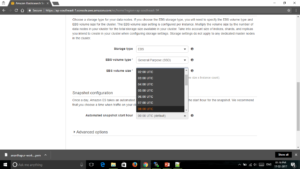
- Select storage type as EBS
- Select EBS volume type as General Purpose(SSD)
- Select the EBS volume size as 08:00 UTC
- As shown in the below image
- After that select the Automated snapshot start hour as 00:00 UTC(default)
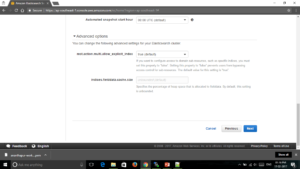
- Under Advanced Options select default options
- After that click on next button as shown in the below image.
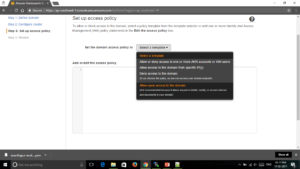
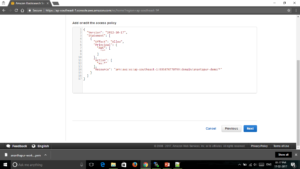
- In the step 3 Set the Dmain access polocy as Allow open access to the domain.
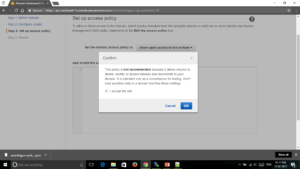
- After selecting that you will see the confirm popup click on Ok button as shown in the beow image.
- After clicking on ok button youwill see the access polocy code.
- Then click on confirm and create button as shown in below.
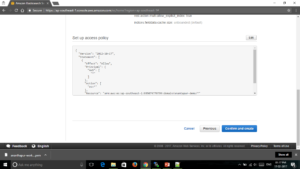
- If you want to edit the access polocy code you can edit if you dont want to edit click on the next button as shown in the below image.
- After that you will get the message as you have successfully created Elasticsearch domain
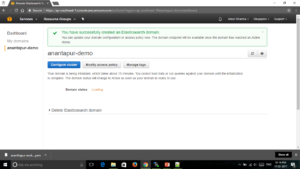
- It takes 10 minutes time to start the domain
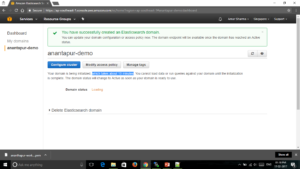
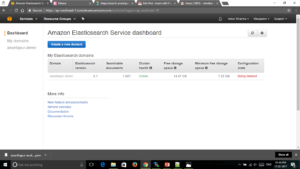
- Now you can see the Dmain status as Active
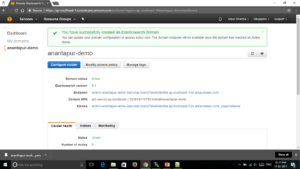
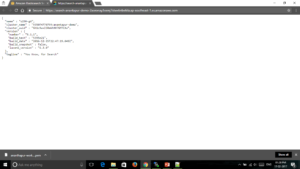
- Click on the link Endpoint to confirm if Elasticsearchis up or not – the o/p similar to below Image will ensure that Elasticsearch is up and running.
- After that click on the kibana link you will see images as shon below
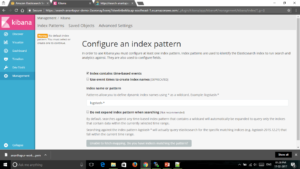
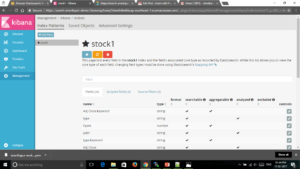
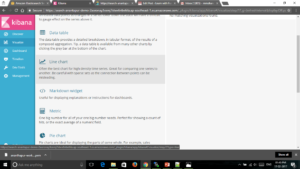
- The above image is Kibana Dashboard
- Enter the Index Name as Stack1.
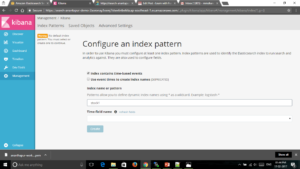
- Select Time-field name as DATE
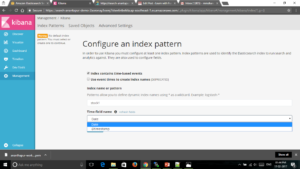
- After selecting the Date field click on create button you will see the image as shown below.
- After successfully created dashboard click on the Discover tab it is in the left pane of dasshboard.
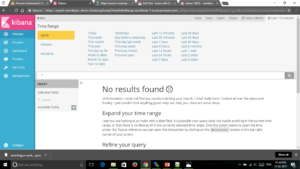
- In above page you can check the data on which date do you want, the below image is showing data from last 2 years.
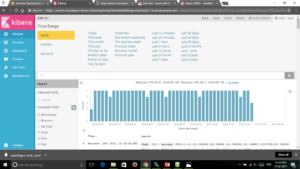
- Click on visualize tab it is in left pane of dashboard.
- From visualized tab click on any type of chart which type do you want to see as shown in the below Image.
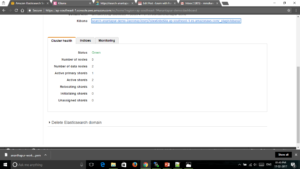
- After complition of your tasks come back to your Elasticsearch domain
- You will the option Delete Elasticsearch domain as shown in the below Image
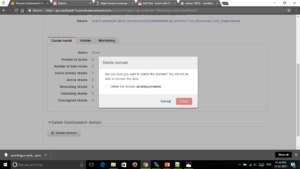
- Click on Delete Domain button you will see the popup and again click on delete button.
- The below Image is showing the ananthapur-demo is being deleted.